Trade Monitoring and India’s G20 Presidency
This platform serves as a comprehensive repository for all G20-related trade data. It offers interactive dashboards and informative factsheets that present both aggregated and country-level metrics. These visual resources encompass static and time series trend analyses, effectively transforming raw trade data into actionable insights that cater to diverse stakeholders.
G20: State of Trade
The following three dashboards map G20 engagement on three key factors that are affecting trade flows.
How does the G20 trade?
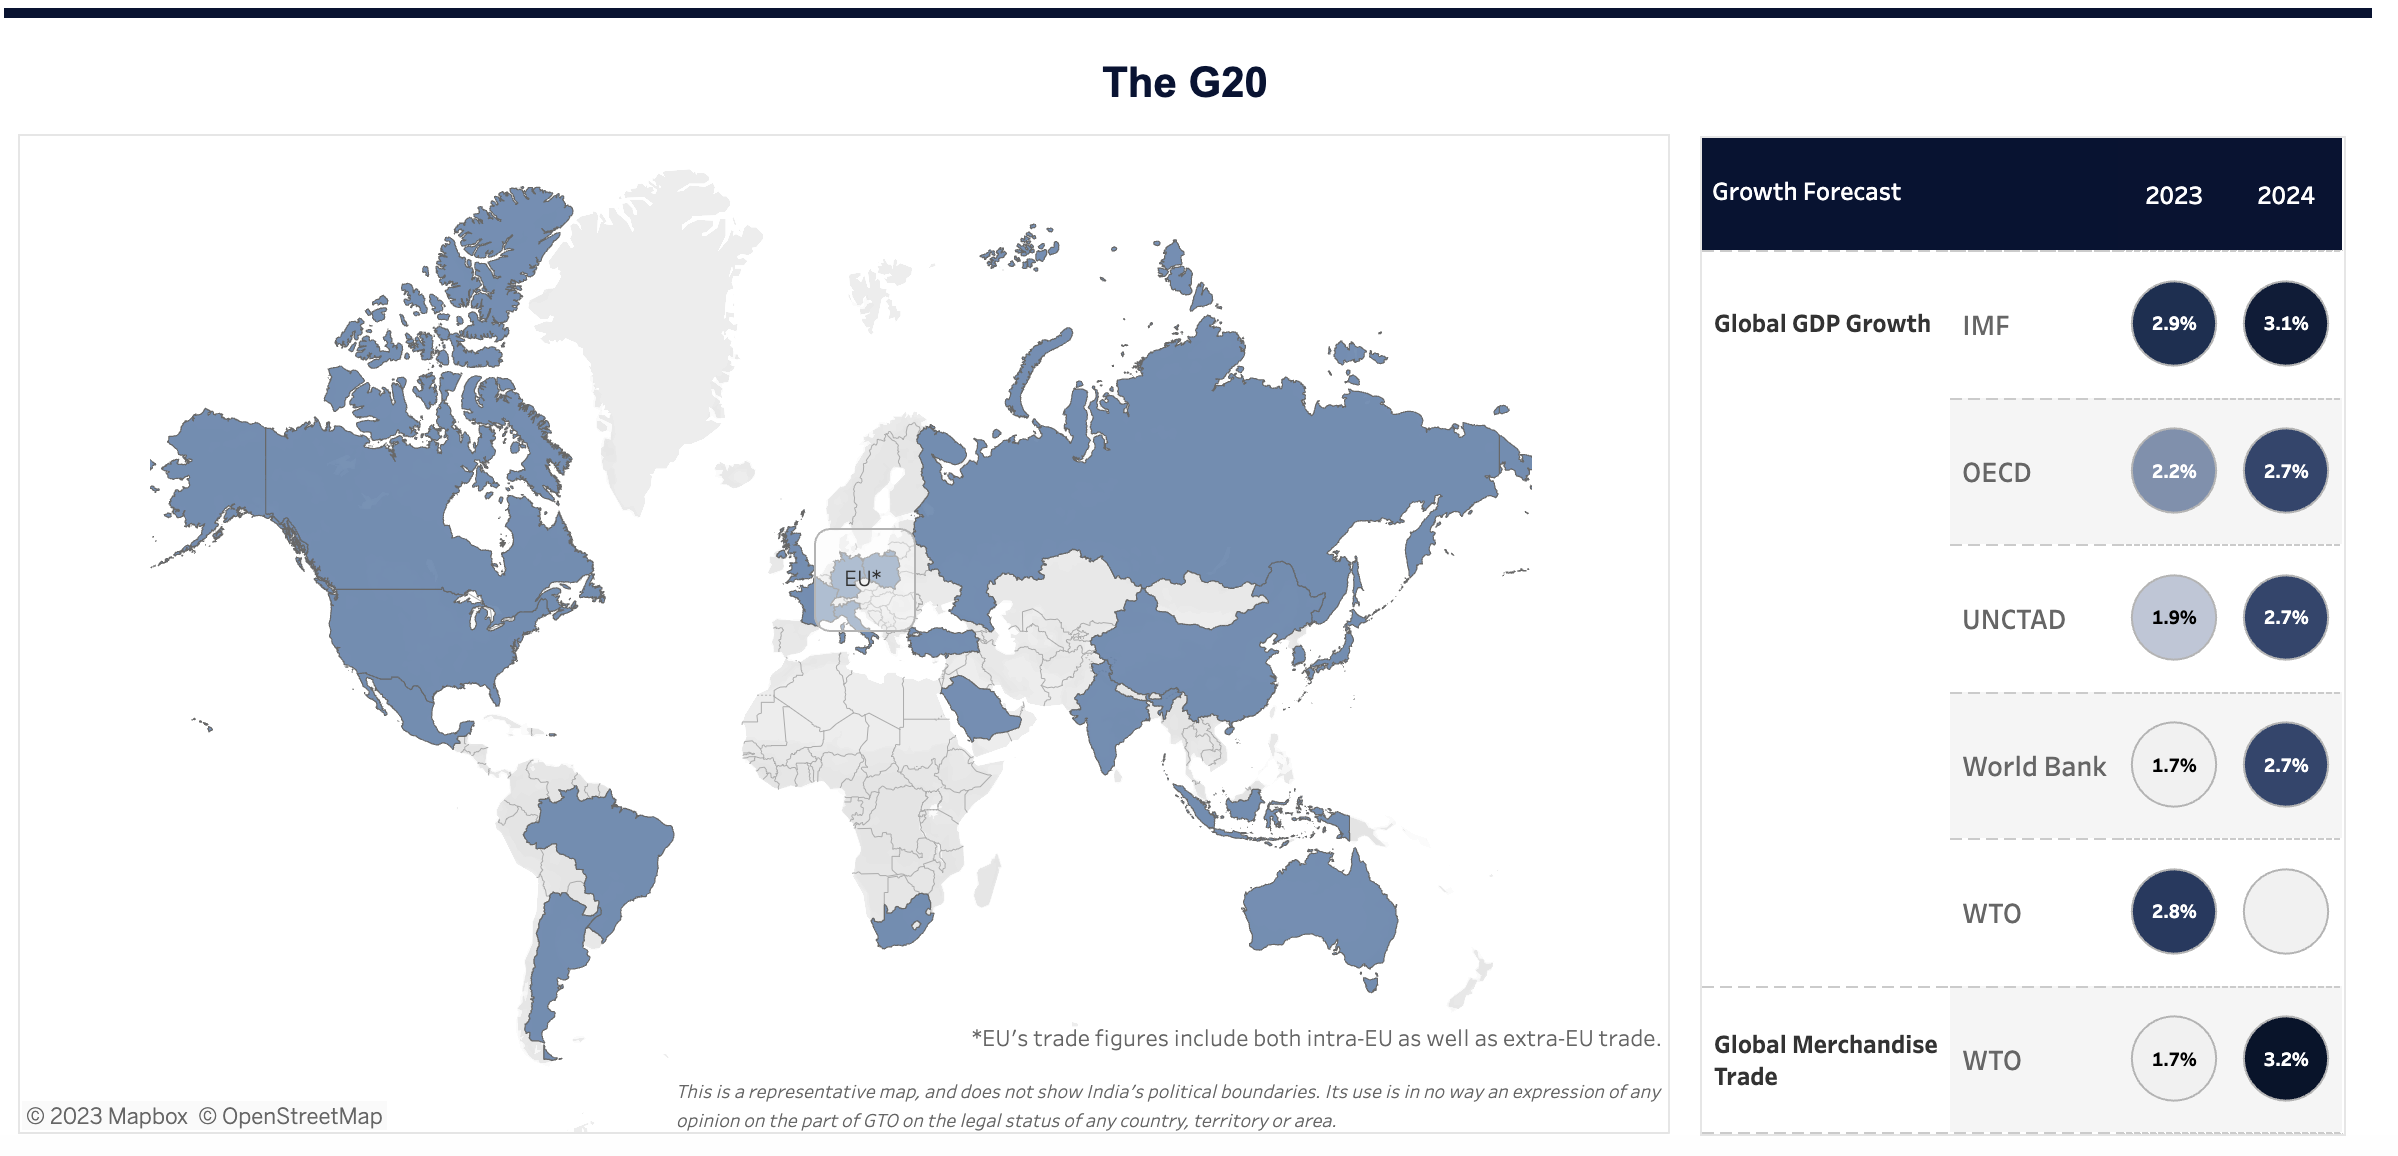
Growth Prospects
This dashboard provides an overview of the economic performance of the G20 in terms of trade and GDP growth and gives insights into relative trade flows and performances within the G20.
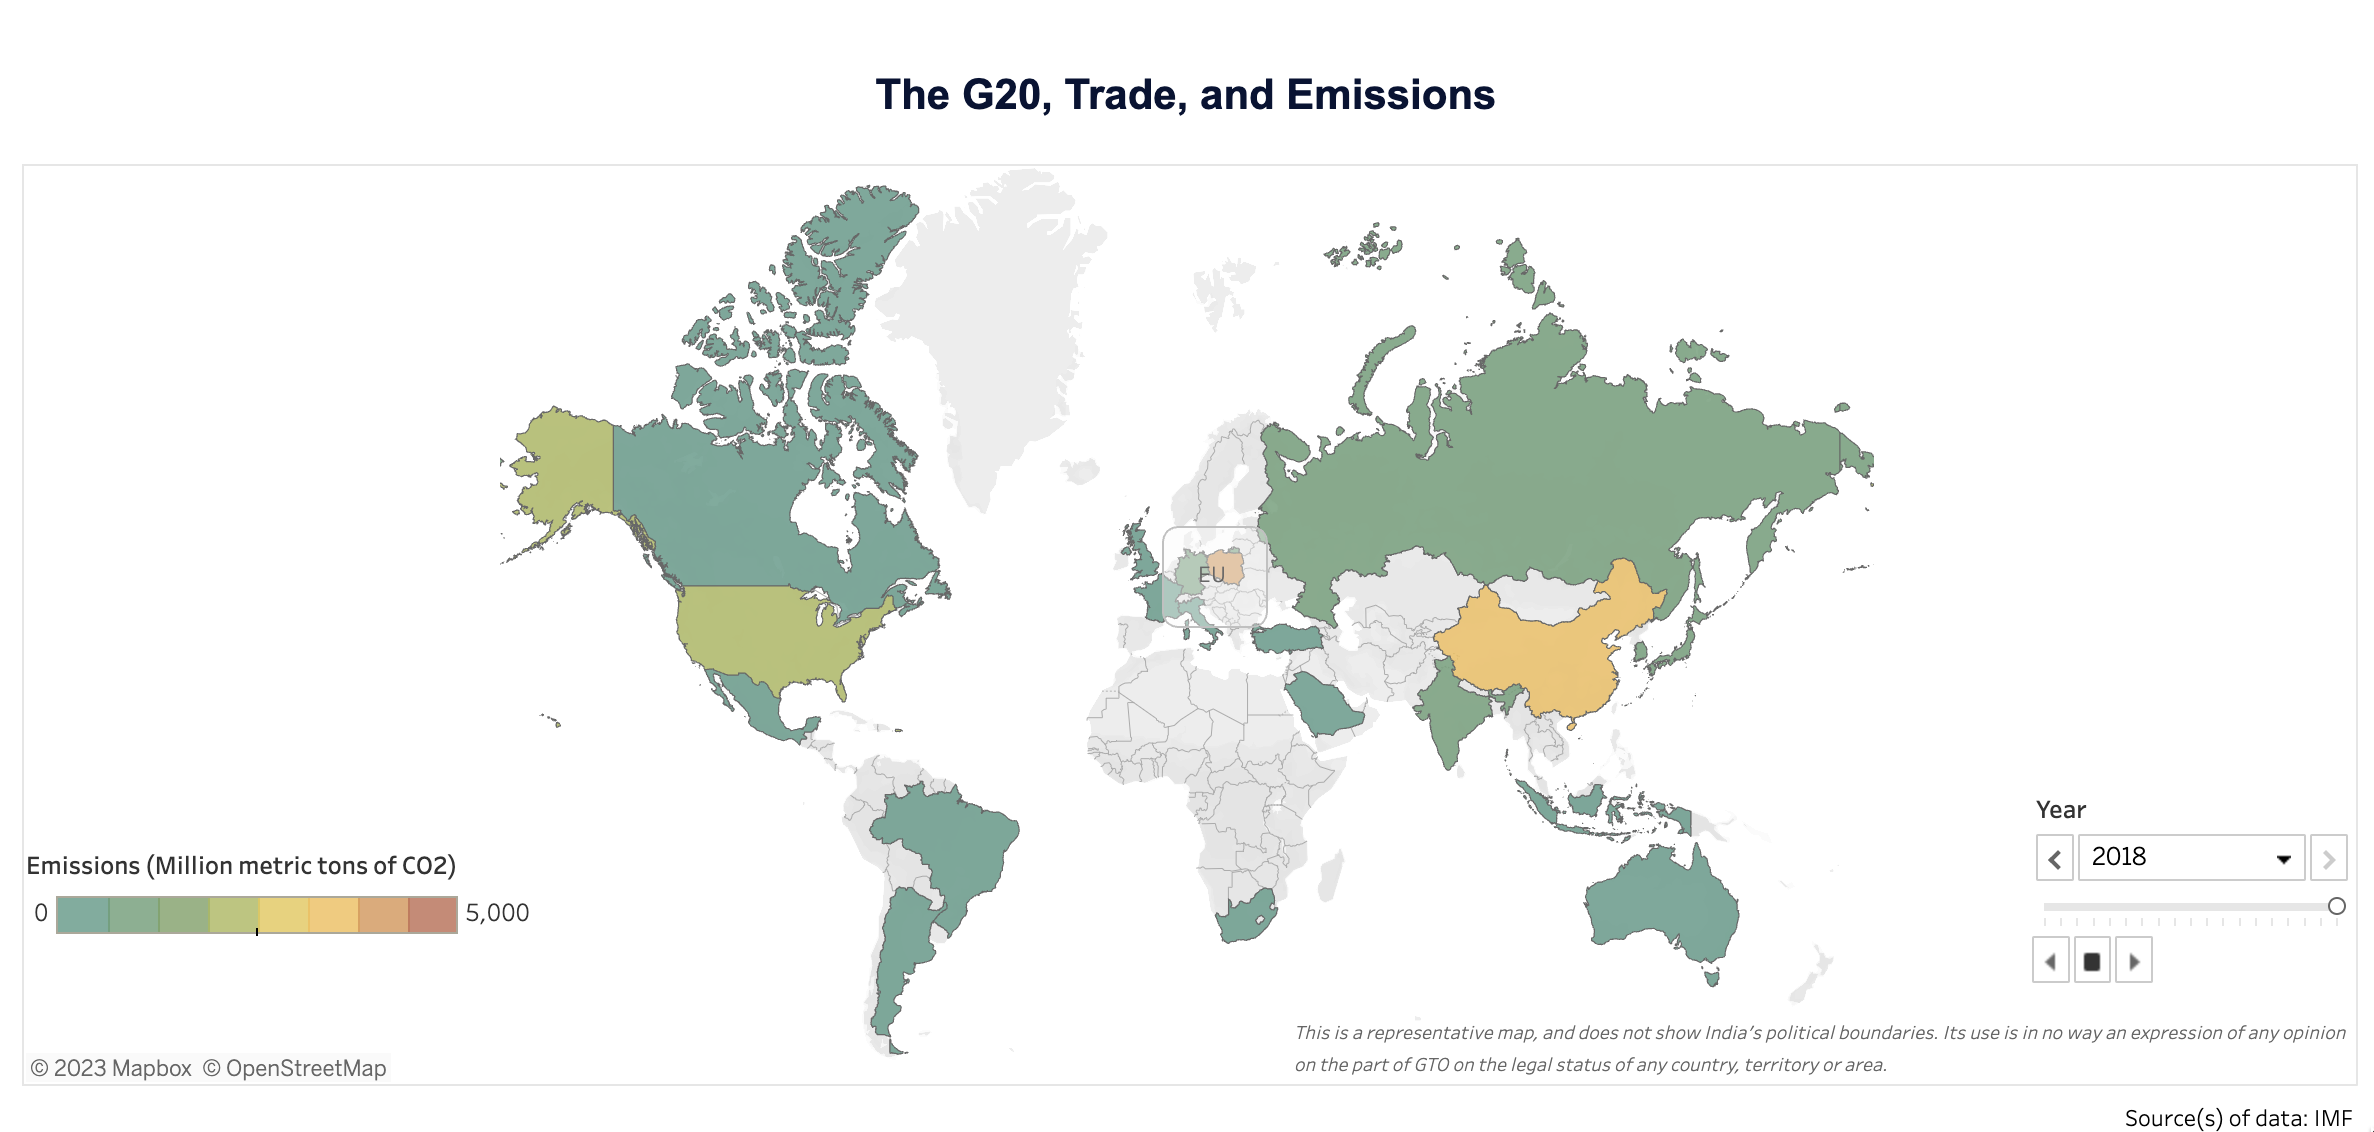
Environment and Trade
This dashboard analyses international trade through the lens of carbon dioxide emissions stemming from the production and distribution of traded goods and services among G20 economies. It also sheds light on the trends and competitiveness of environmental goods trade within the G20.
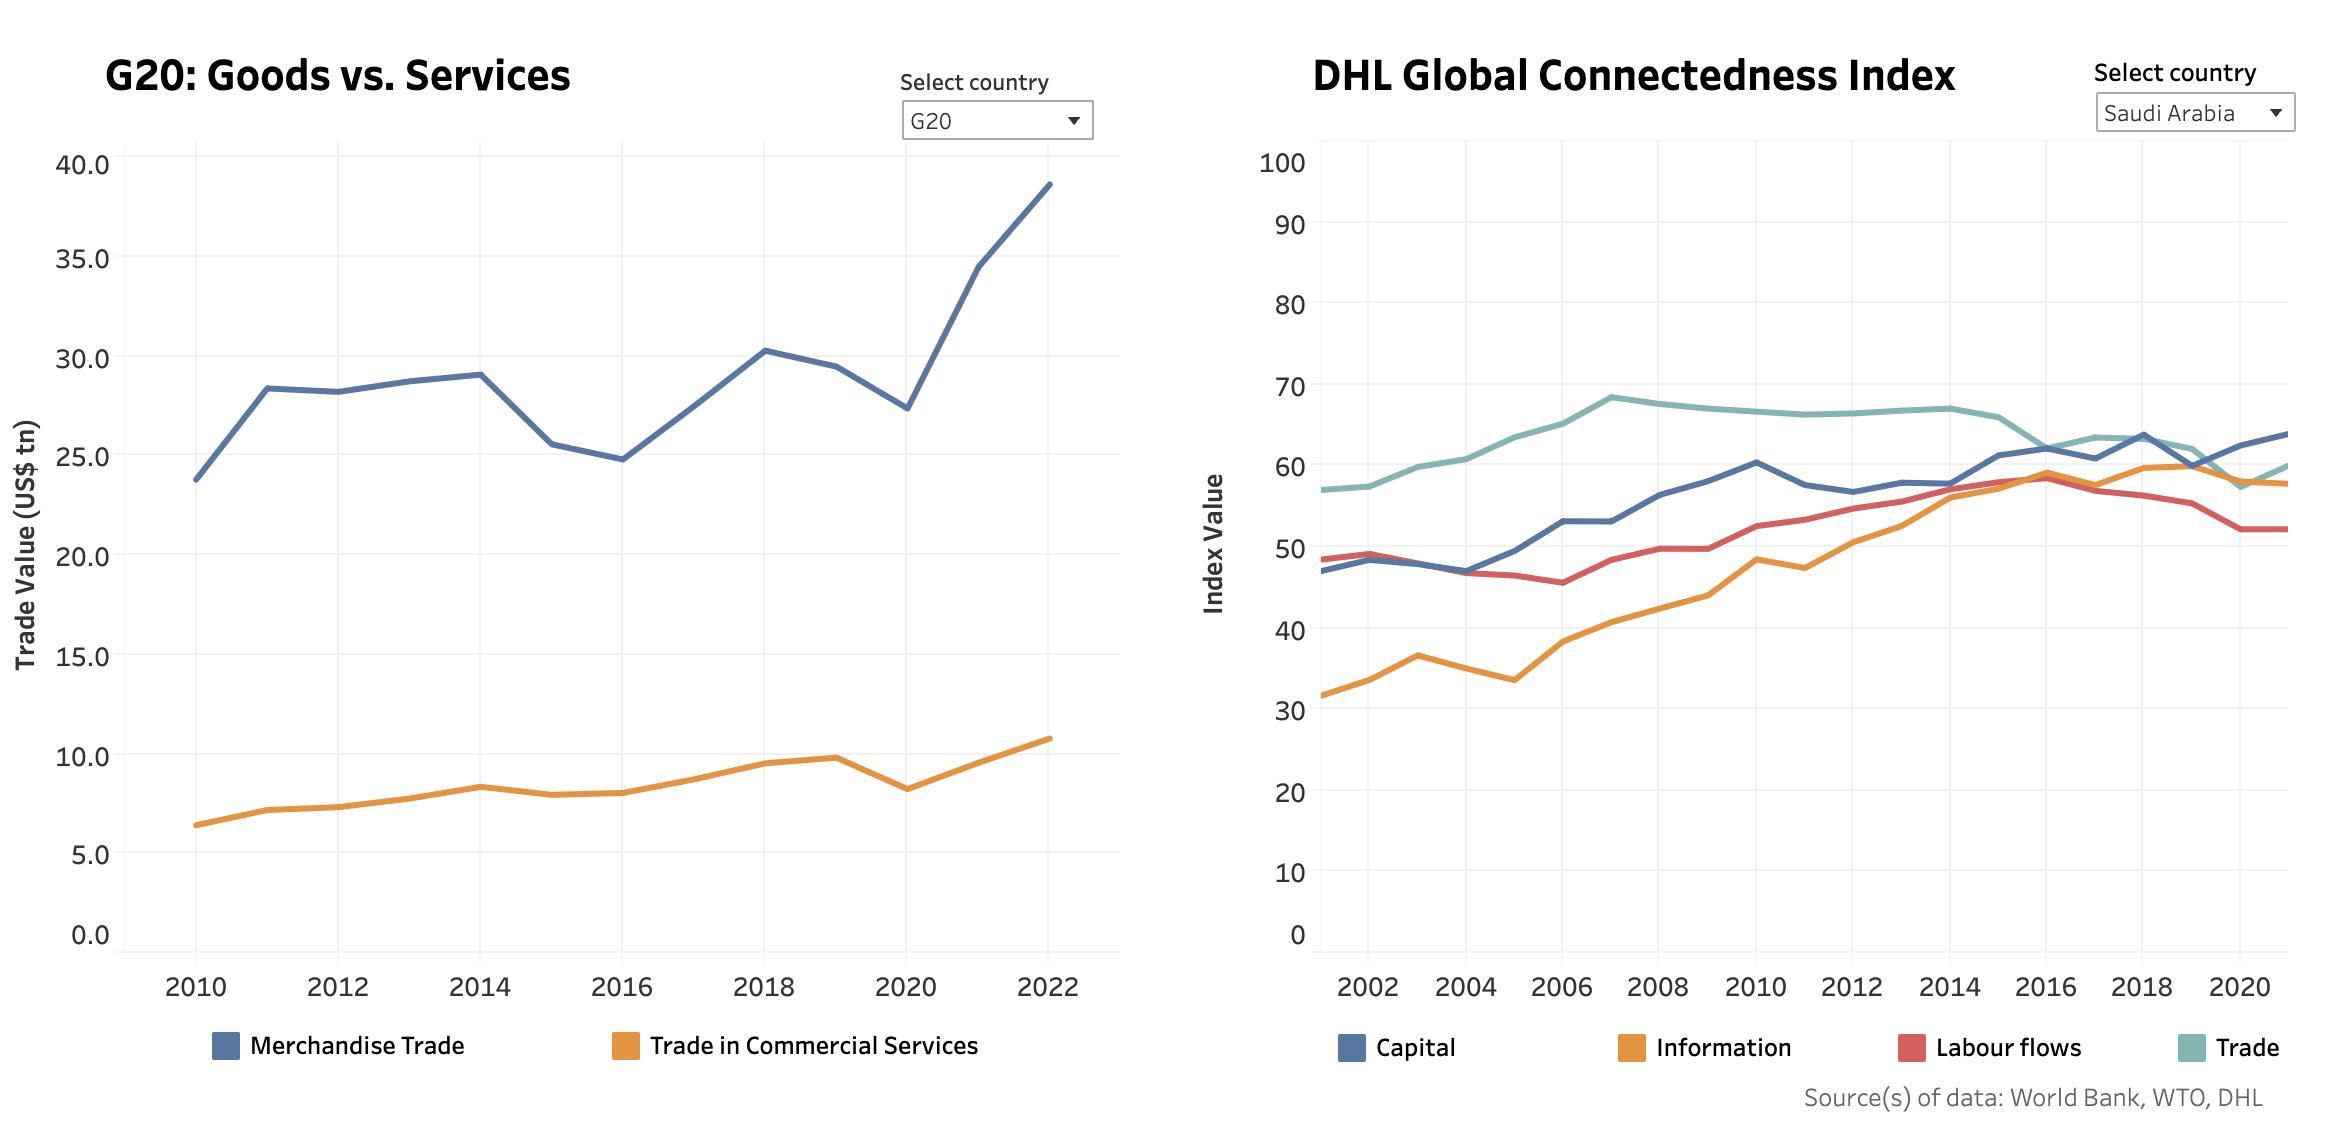
Services and Data
This dashboard provides a comprehensive view of the G20 economies’ trade in commercial services and digitally deliverable services. Additionally, the dashboard also highlights major trading economies and their trade balances.
India's TIWG priorities
The following two dashboards focus on two of the stated trade and investment priorities under India's G20 presidency.
GVC participation and logistics

Global Value Chains
This dashboard presents an overview of G20 economies’ participation in global value chains, with key indicators like forward and backward linkages; and domestic and foreign value added in gross exports.
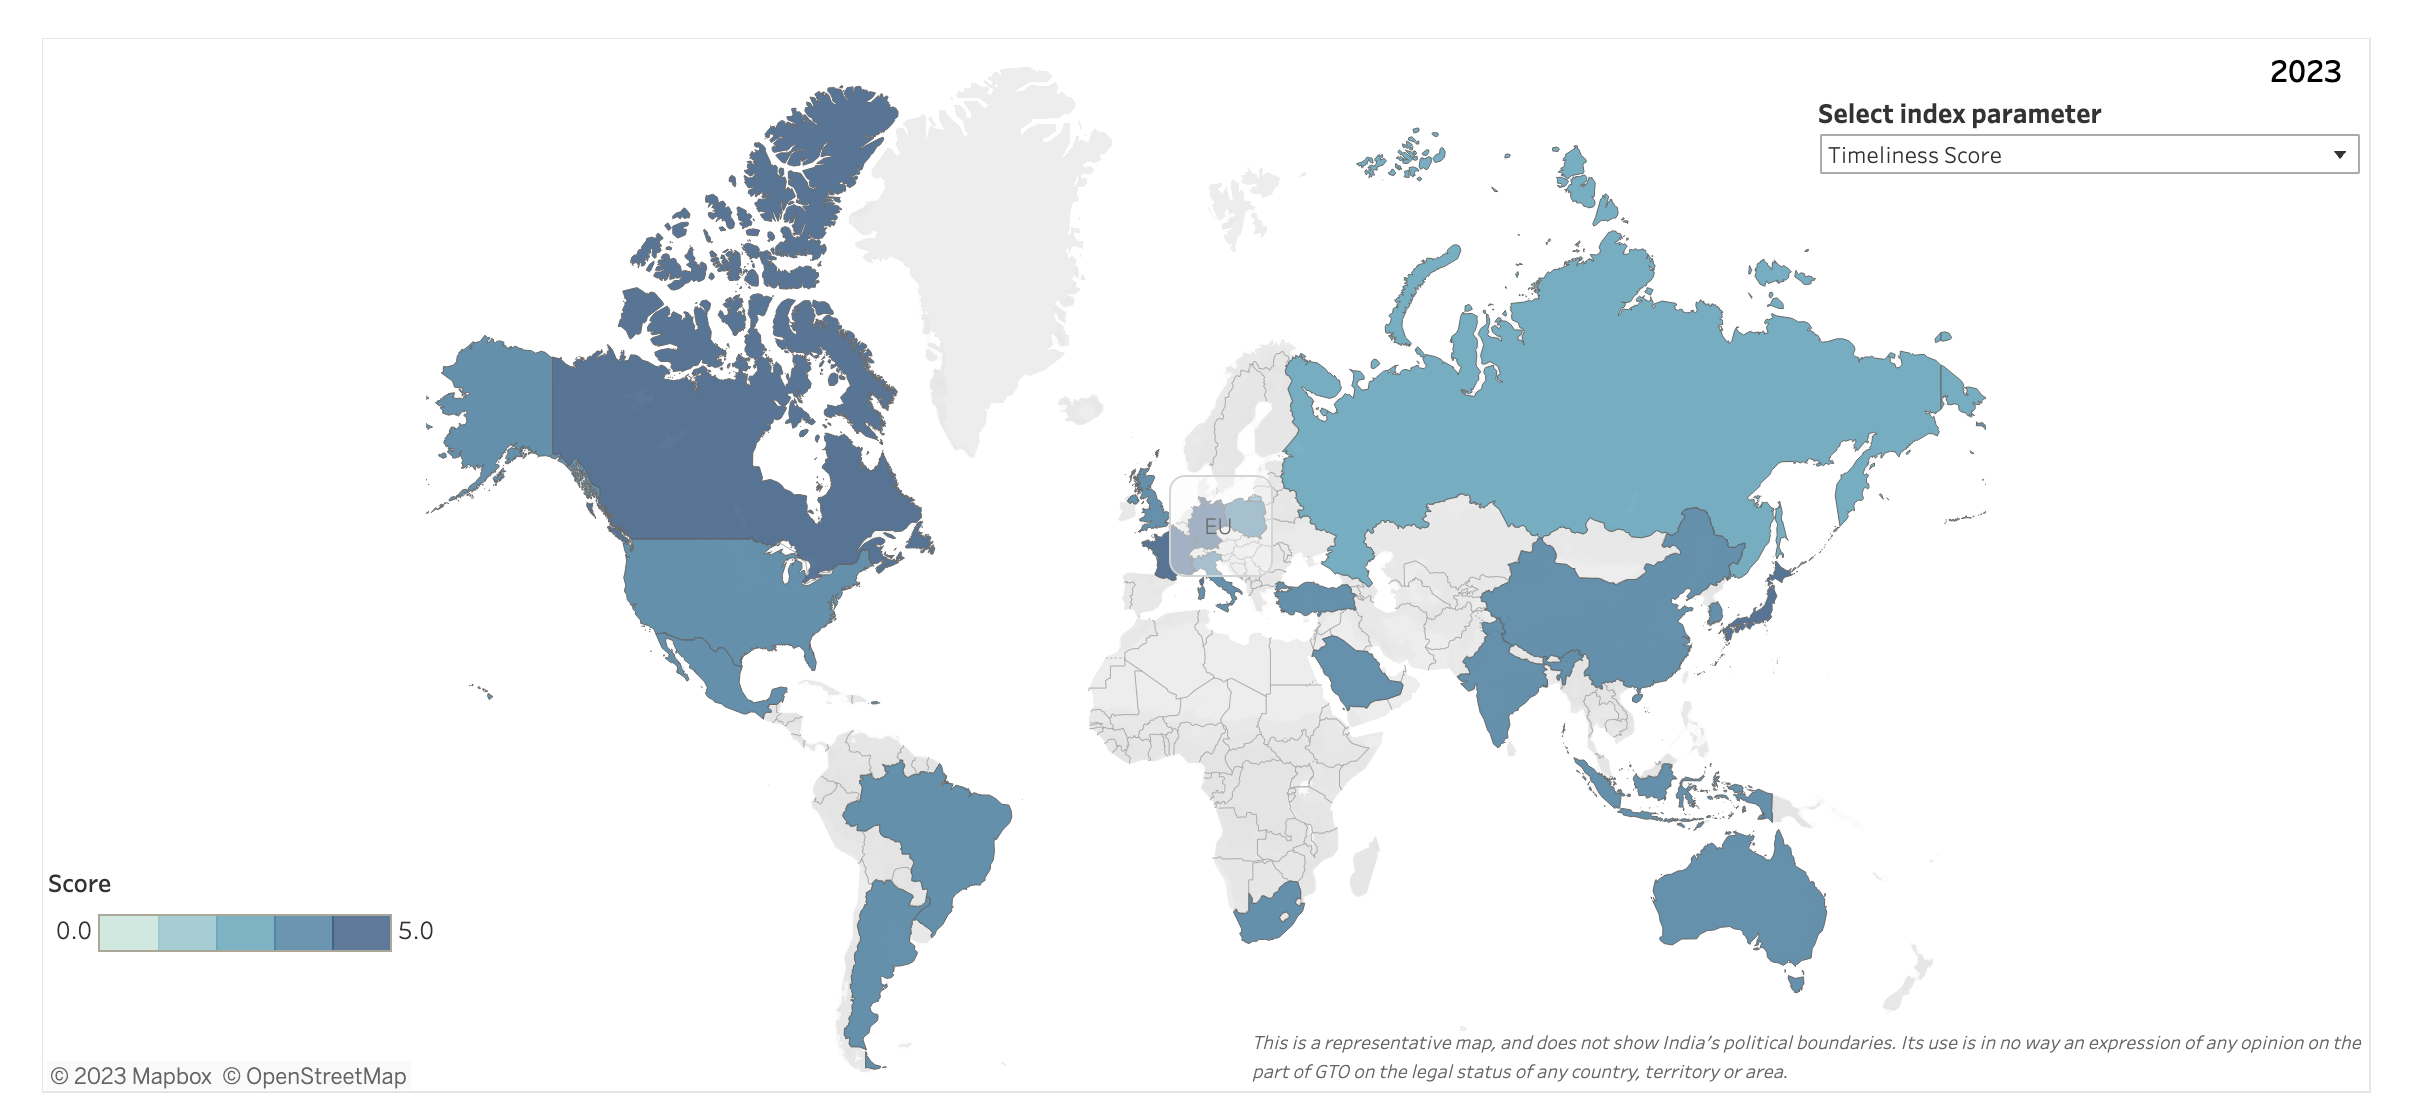
Logistics
This dashboard visualizes the performance of G20 economies across multiple parameters in the field of logistics, as defined by the World Bank and the World Trade Organization.